Economic Developments - March 2024
For a PDF version of this report, click here.
We have modestly revised downward our total home sales outlook this month, primarily driven by an upgrade to our mortgage rate forecast. Job growth and inflation data continue to come in comparatively strong. Financial markets are now pricing in lower odds of aggressive fed funds rate cuts this year, leading to some upward drift in the mid-to-longer range of the interest rate curve, including mortgage rates. Thus, we forecast the 30-year mortgage rate to end 2024 at 6.4 percent, up from 5.9 percent in our previous forecast. The change to our mortgage rate outlook was the principal driver of a downward revision to our total home sales forecast to 4.91 million in 2024 (previously 5.00 million) and 5.40 million in 2025 (previously 5.54 million). Our total single-family mortgage originations forecast was revised downward to $1.76 trillion in 2024 (previously $1.92 trillion) and $2.18 trillion in 2025 (previously $2.36 trillion). We also pared back our mortgage originations outlook modestly due to an upward revision to our expectation for the cash share of home purchases based on recent data.
We revised upward slightly our real gross domestic product (GDP) forecast for Q1 2024 to 2.4 percent annualized from 2.1 percent annualized, which reflects the impact of revisions to the reported composition of Q4 2023 growth on early 2024 trends. We are continuing to forecast a deceleration in GDP growth this year to 1.7 percent on a Q4/Q4 basis (unchanged from prior forecast), as well as a slower rate of job growth and a slowly increasing unemployment rate. It should be noted that there is currently an unusually high discrepancy among various recent labor market measures, adding to uncertainty over the near-term economic outlook and, therefore, also the likely path of future monetary policy and mortgage rates.
Job Growth Expected to Slow
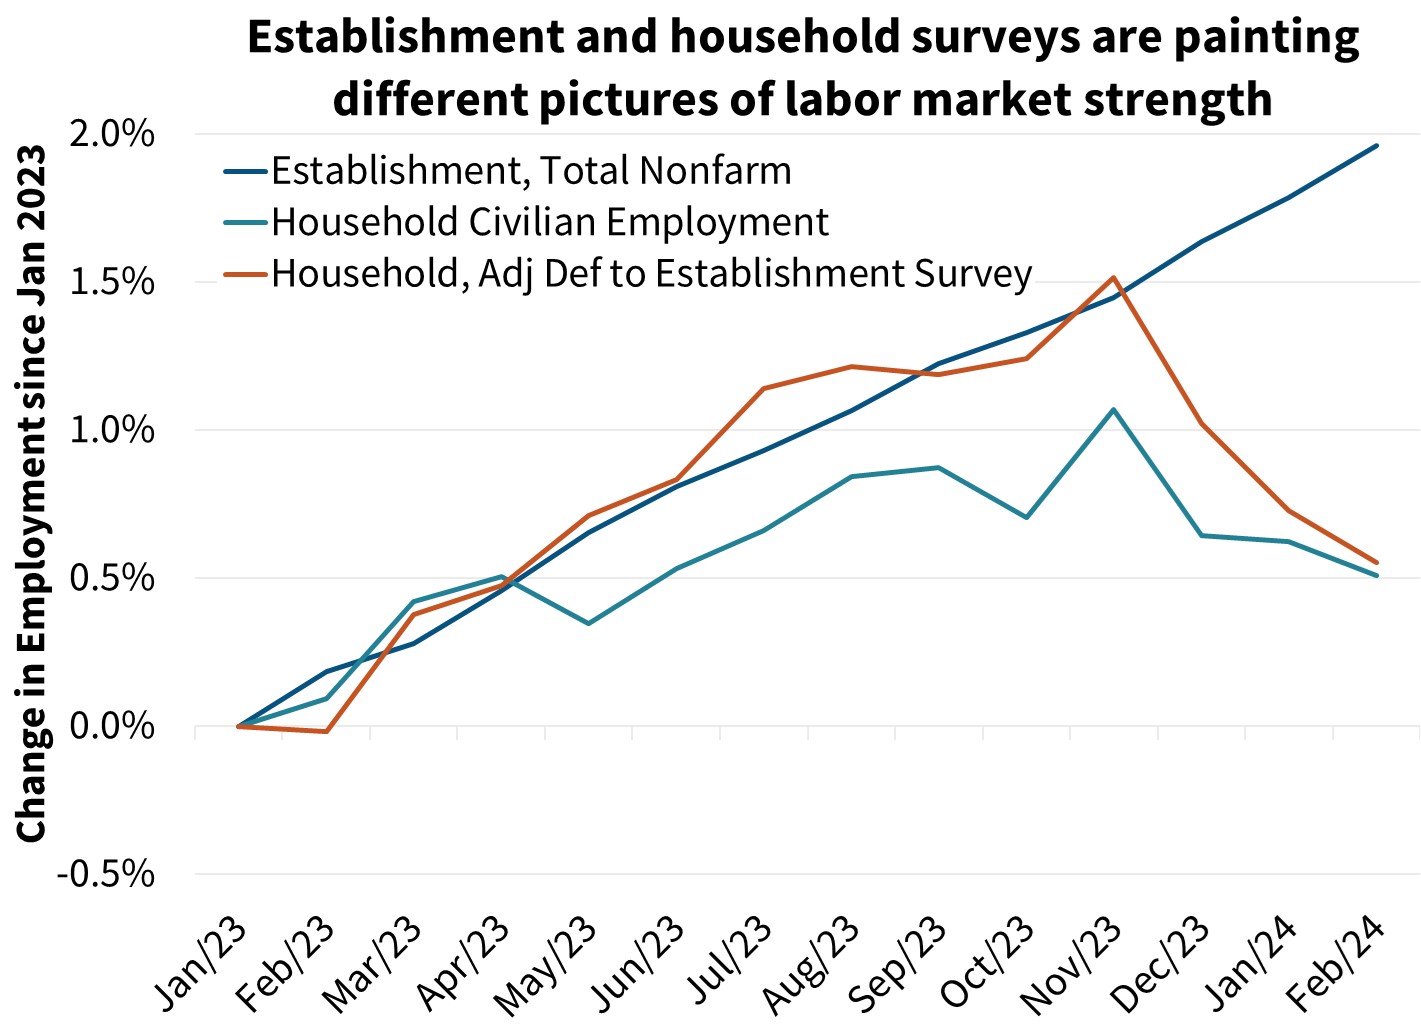
We think the true strength of the labor market is somewhere in between the still-relatively robust establishment survey and the near-recessionary job declines in the household survey. This is consistent with a slowing economy. Data from the Institute for Supply Management (ISM) indices and the National Federation of Independent Business’s (NFIB) survey of small businesses, as well as measures of aggregate hours worked, suggest labor demand is likely softening. However, we do not see widespread evidence of job cuts. Layoffs and discharges from the Job Openings and Labor Turnover Survey (JOLTS) remain near historically low levels, and both initial and continuing unemployment claims are roughly at the same level as in early November when the household employment survey began deteriorating. As such, our forecast continues to call for slower job growth and a gradual upward drift in the unemployment rate, but for our base case forecast we do not expect outright job declines.
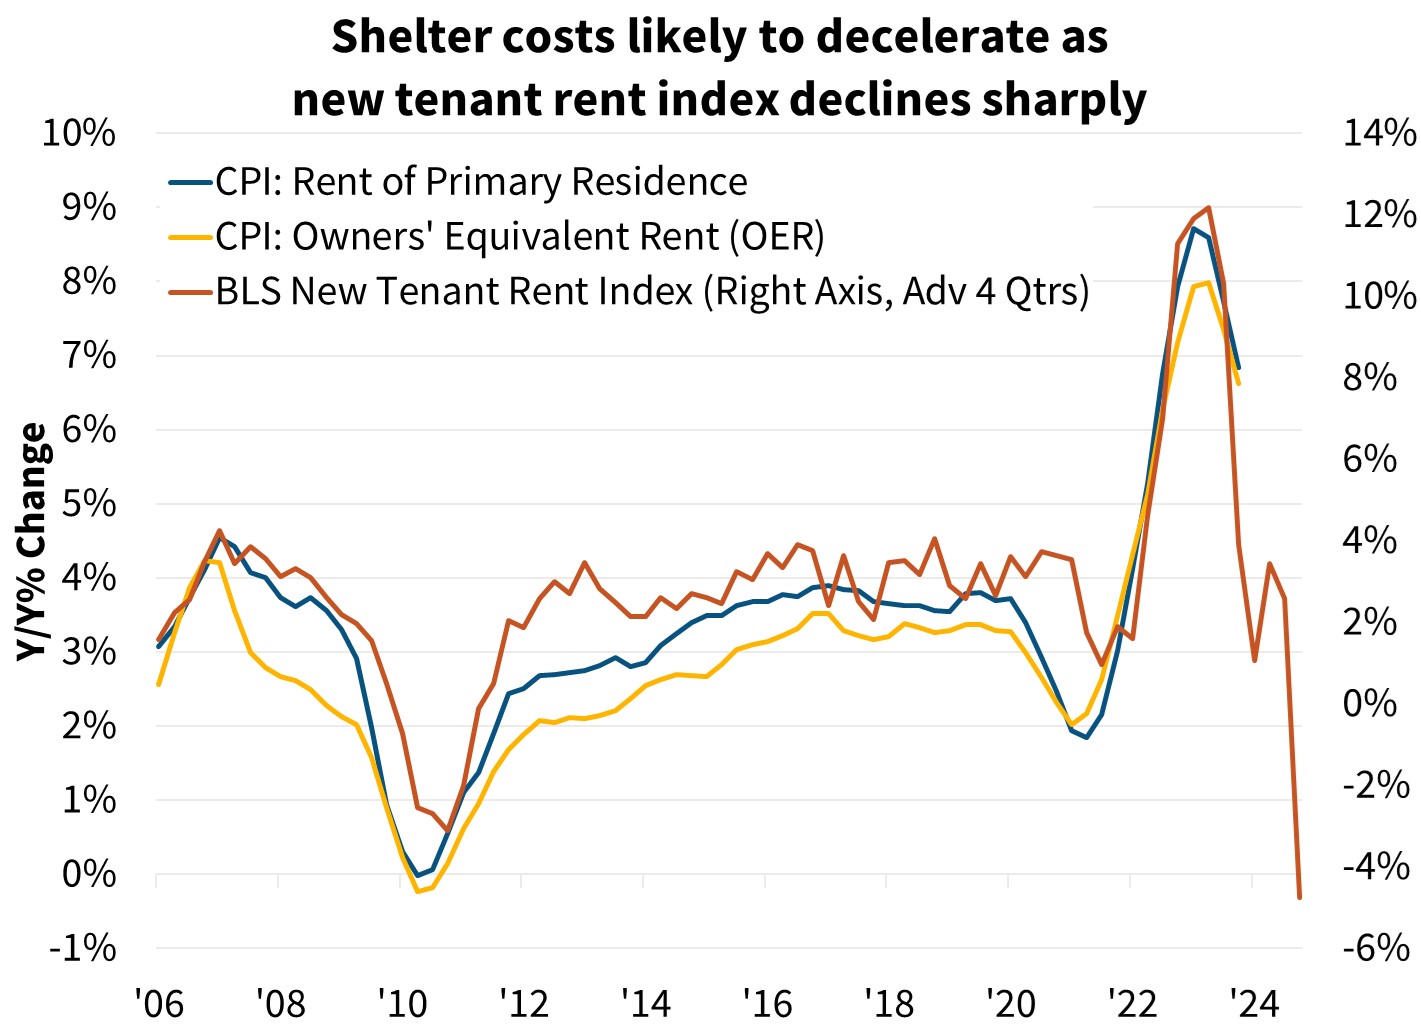
Headline Consumer Price Index (CPI), which was released following the conclusion of our forecast, rose 0.4 percent over the month in February, pushing the year-over-year comparison up one-tenth to 3.2 percent. While part of the strength was due to a 3.8 percent jump in volatile gasoline prices, the larger story was the beat on core inflation, which also rose 0.4 percent over the month and was up 3.8 percent compared to a year earlier. Still, the underlying details were a bit more encouraging than the topline figure. The 0.5 percent increase in used auto prices is likely more noise than signal after a 3.4 percent drop the month prior, and we continue to expect deflation in core goods to resume in future months as used autos auction data continues to show price contraction. Furthermore, the 3.6 percent rise in airline fares is related to a similar-sized increase in oil prices. Owners’ equivalent rent (OER) slowed to a 0.4 percent month-over-month gain after a surprising 0.6 percent increase in January. We continue to see disinflationary forces related to shelter in the pipeline, as 2.0 percentage points of the 3.2 percent year-over-year gain in the CPI was due to lagged shelter data and the Bureau of Labor Statistics’ (BLS) own measure of new tenant rent was sharply negative in Q4 of last year. Over time, this should translate into lower measures of CPI shelter costs. Still, we believe this CPI report is unlikely to provide the “greater confidence” the Fed and Chair Powell are looking for to begin cutting interest rates. For now, we continue to expect the first rate cut to occur in June. If inflation data continue to surprise to the upside in coming months, however, the Fed may not begin cutting until later in 2024.
In our view, whether the Fed begins cutting interest rates in June or later in the year is likely to have only a small impact on the macroeconomy and mortgage rates. In contrast, we believe the market’s expectations of the cumulative change in the fed funds rate over the next two to three years will likely have a more meaningful impact on mortgage rates. At the beginning of 2024, futures markets were pricing in about 150 basis points of cuts for 2024, but as of this writing futures suggest only about 75 basis points. If inflation prints continue to come in hot (even if they can be explained away by oddities) and payroll employment growth remains as strong as the last report (even if other labor market metrics show weaker conditions), then we suspect the odds of comparative large Fed easing will continue to diminish. We think the Fed is likely to be more cautious if the hard data are not conclusively pointing to a slowing pace of employment gains and inflation given the risk of a resurgence in inflation if they move too early.
One thing we, and the market, expect at the March Federal Open Market Committee (FOMC) meeting is some discussion of the policy regarding their balance sheet. The Chair noted at the last press conference that it would be a topic of discussion at the March meeting.
We have revised downward our outlook for home sales this month largely due to the higher interest rate outlook. However, we still expect an upward path in sales over the year even if there are some bumps along the way.
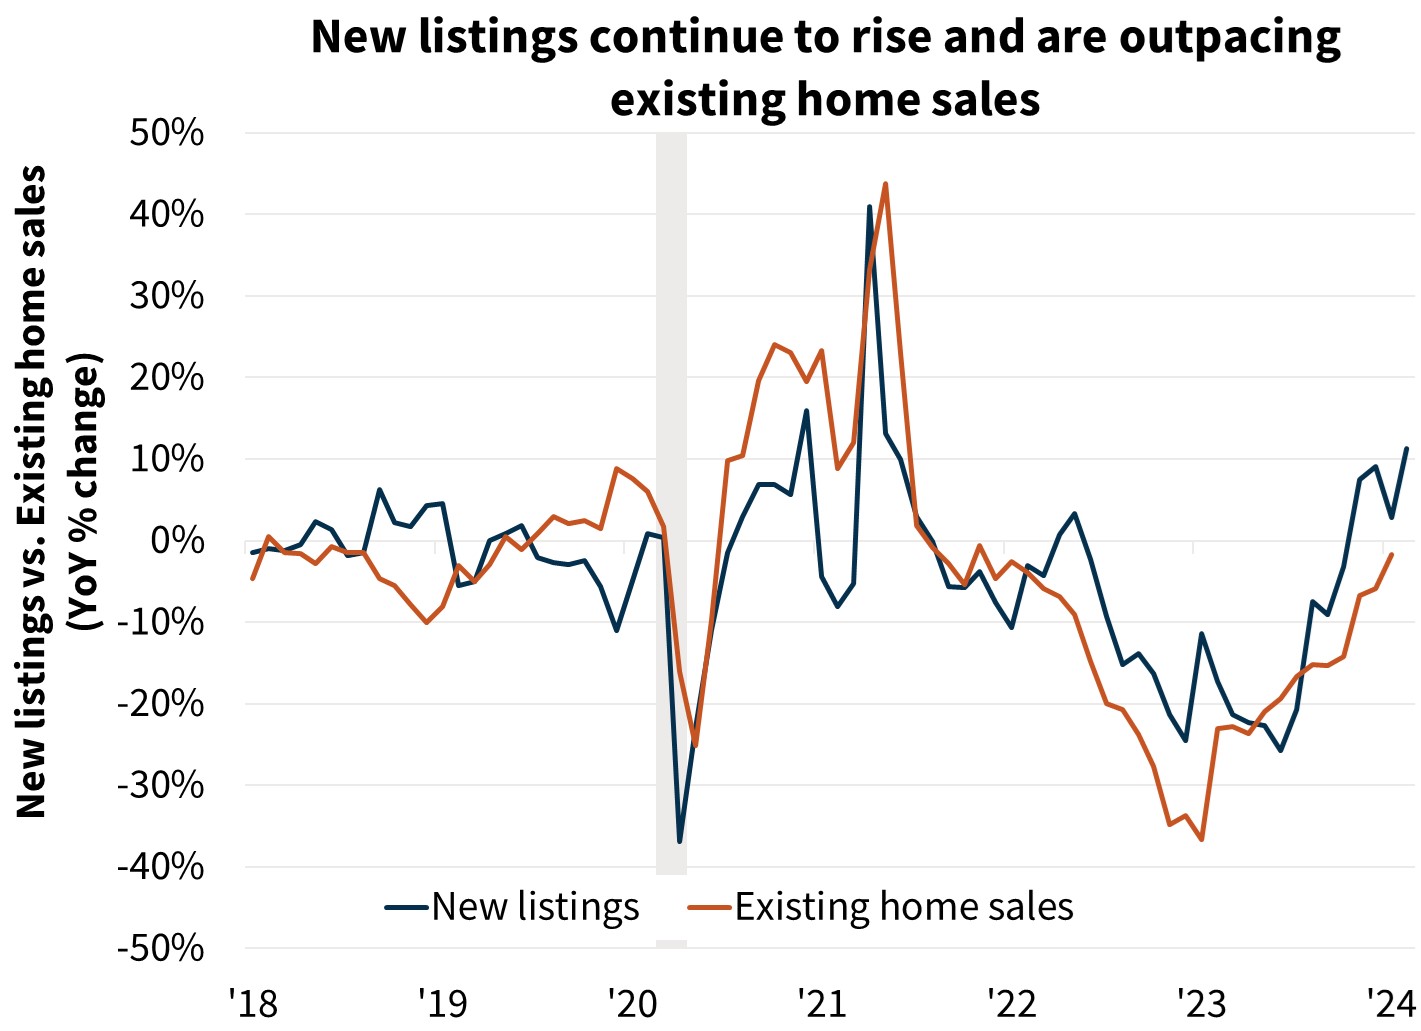
Mortgage rates rising off their end-of-2023 lows has led to a slowdown in home purchase activity. While existing sales rose 3.1 percent in January to an annualized pace of 4.0 million, these increases reflected mortgage rates in November and December. Pending sales, which lead closings on average by a month or two, fell in January by 4.9 percent, pointing to a likely pullback in February. We have modestly revised downward our view of existing home sales in the near term based on this data; however, we continue to expect a generally upward trend in sales as the year unfolds. We believe an increasing number of transactions will be driven by households who can no longer put off their moves simply due to interest rate lock-in effects because they need to move for life event reasons. Notably, new sales listings for existing homes have continued to rise in recent months even as pending home sales pulled back. According to Realtor.com, the flow of new listings in February was up 11.3 percent from a year prior. This also aligns with the Fannie Mae Home Purchase Sentiment Index® (HPSI), which has showed comparative strength over the past two months, with the "good time to sell" component acting as one of the main drivers. We are expecting existing sales to drift upward to a pace of near 4.40 million annualized units by the end of 2024 (compared to the 4.00 million shown in the January release from the National Association of REALTORS®), even though we are anticipating the February sales pace to pull back.
While we do not explicitly forecast new home listings, a future rise in listings is also expected to outpace the growth in sales, leading to a gradual loosening of the currently very tight housing market. An increase in the months' supply of homes for sales should also lead to some deceleration in home price growth over the next several years, even if a general lack of supply keeps home price appreciation positive despite affordability measures being stretched.
Economic Forecast Changes
Economic Growth
The second estimate for Q1 2024 GDP growth from the Bureau of Economic Analysis (BEA) showed that GDP grew an annualized 3.2 percent, one-tenth lower than the initial estimate. The major change from our prior forecast is stronger Q1 2024 growth, while also modestly shifting up the GDP path in 2025, though we still expect growth in full-year 2024 will slow to a below-trend pace. Our 2024 GDP outlook was unchanged at a 1.7 percent Q4/Q4 increase, while the 2025 outlook was revised upward two-tenths to 1.8 percent.

Labor Market
Nonfarm payroll employment growth was 275,000 in February, while the gain in January was revised downward by 124,000 to a gain of 229,000. The unemployment rate rose two-tenths to 3.9 percent, its highest level since January 2022. Compared to last month, our forecasted unemployment rate was essentially unchanged; we continue to expect a gradual uptick over the coming quarters, though we expect the unemployment rate to remain below the Non-Accelerating Inflation Rate of Unemployment (NAIRU), estimated by the Congressional Budget Office to currently be 4.4 percent.

Inflation & Monetary Policy
The February CPI report came out after the completion of our forecast, with the headline being in line with our expectations, while core inflation was somewhat hotter. Headline CPI grew 0.4 percent over the month and grew 3.2 percent compared to a year ago. Core inflation was more persistent, and rose 0.4 percent over the month, with the annual rate only decelerating by one-tenth to 3.8 percent as shelter inflation remains hot, though it did slow compared to last month’s large increase. The major change to our inflation expectations came from a higher oil price path, as well as a reassessment of our OER expectations. As the February CPI report shows, there is still upside risk to our inflation expectations.
Our baseline expectation continues to be that the Fed will not raise rates further this cycle and will keep policy tight until June, when we expect the first rate cut.

Housing & Mortgage Forecast Changes
Mortgage Rates
Following the increase in interest rates in February, our interest rate forecast has been upgraded this month. We now expect the 30-year fixed rate mortgage rate to average 6.6 percent in 2024 and 6.2 percent in 2025, upgrades of four-tenths and five-tenths, respectively. However, interest rates remain volatile, particularly given changes in Fed policy expectations, which adds risk to our outlook for interest rates.

Existing Home Sales
Existing home sales were reported at a seasonally-adjusted annualized rate (SAAR) of 4.00 million in January. We have revised downward our forecast modestly through 2025, largely due to the higher projected interest rate environment, though we continue to believe that existing sales will trend upward over our forecast horizon.

New Home Sales
New single-family home sales rose 1.5 percent to a SAAR of 661,000 in January. Similar to our existing home sales forecast, sales in 2024 were revised downward due to higher interest rate expectations, as well as an adjustment stemming from recent incoming data. New home sales continue to benefit from the limited inventory of existing homes for sale, which we expect to support demand for new homes in the coming months.

Single-Family Housing Starts
Single-family housing starts fell to a SAAR of 1.00 million in January, while permits rose to 1.02 million. We continue to expect a pullback in the first quarter of 2024, and we have revised our forecast downward mostly to reflect the higher interest rate outlook. We continue to expect that the lack of existing homes available for sale will continue to boost new home construction in the medium term.

Multifamily Housing Starts
Multifamily housing starts fell sharply to a SAAR of 327,000 in January, while permits fell more gradually to a SAAR of 468,000. We have downgraded our near-term forecast to reflect incoming data, and multifamily starts remain likely to decline as national rent growth has been muted and more multifamily units near completion.

Single-Family Home Prices
Home prices grew 7.1 percent Q4/Q4 in 2023, according to the most recently published non-seasonally adjusted Fannie Mae Home Price Index (HPI) and are forecast to rise 3.2 percent in 2024 on a Q4/Q4 basis. Our next home price update will be in April.
")
Single-Family Mortgage Originations
We have downgraded our outlook for purchase originations due to downgrades to the home sales forecast (which in turn stems from a higher mortgage rate outlook), as well as incoming data indicating a continued higher cash share of purchase transactions occurring. We expect purchase origination volume to be $1.4 trillion in 2024, representing 12 percent growth from 2023 but a downgrade of $90 billion from our prior forecast. In 2025, we expect purchase volume to grow by a further 14 percent to $1.6 trillion, though this level is also a downgrade from the prior forecast.
We now expect 2024 refinance originations to be $397 billion, a downgrade of $62 billion from the prior forecast, given this month's higher mortgage rate expectation. We expect 2025 refinance originations to be $626 billion, also a downgrade from the prior forecast but representing growth from 2023, as mortgage rates are expected to gradually decline into 2025 and additional borrowers gain a rate incentive to refinance.

Economic & Strategic Research (ESR) Group
March 15, 2024
For a snapshot of macroeconomic and housing data between the monthly forecasts, please read ESR's Economic and Housing Weekly Notes.
Data sources for charts: Bureau of Economic Analysis, Bureau of Labor Statistics, Census Bureau, Realtor.com, National Association of REALTORS, Freddie Mac, Fannie Mae
Opinions, analyses, estimates, forecasts and other views of Fannie Mae's Economic & Strategic Research (ESR) Group included in these materials should not be construed as indicating Fannie Mae's business prospects or expected results, are based on a number of assumptions, and are subject to change without notice. How this information affects Fannie Mae will depend on many factors. Although the ESR group bases its opinions, analyses, estimates, forecasts and other views on information it considers reliable, it does not guarantee that the information provided in these materials is accurate, current or suitable for any particular purpose. Changes in the assumptions or the information underlying these views could produce materially different results. The analyses, opinions, estimates, forecasts and other views published by the ESR group represent the views of that group as of the date indicated and do not necessarily represent the views of Fannie Mae or its management.
ESR Macroeconomic Forecast Team
- Doug Duncan, SVP and Chief Economist
- Mark Palim, VP and Deputy Chief Economist
- Eric Brescia, Economics Manager
- Nick Embrey, Economics Manager
- Nathaniel Drake, Economic Analyst
- Richard Goyette, Economic Analyst
- Daniel Schoshinski, Economic Analyst
- Ryan Gavin, Economic Analyst
