Two Years Later: Performance Update for Loans in Hurricane-Affected Regions
Last October, we took a first look at the performance of borrowers affected by the 2017 hurricanes in our publication, Additional Insight into Credit Risk Transfer Reporting for Disaster Relief. We found that after peaking in November 2017, delinquencies in hurricane-affected regions declined as a result of borrowers self-curing, as well as loss mitigation activities. We observed that more than half of the balance of loans that became delinquent in the months immediately following the hurricanes were granted relief in the form of a forbearance plan. However, at the time, it was still too early to draw meaningful conclusions about loan workouts and borrower performance after the temporary forbearance period ended.
With a year of performance history on the earliest post-hurricane modifications, we find that performance has been strong with 97 percent of the loans modified in the first quarter of 2018 either current or prepaid in full.
With nearly a year of additional data, we can now revisit the population of loans in hurricane-affected regions and expand our initial analysis to include modification activity.1 As a reminder, our subject population is loans referenced in Connecticut Avenue Securities® (CAS) transactions and located in hurricane-affected regions that were current in Aug-2017 but became 60 days or more delinquent between Sep-2017 and Dec-2017.2 Of the 8.0 percent of CAS UPB in hurricane-affected regions at the time, only 4.4 percent (or 35 basis points of overall CAS UPB) became 60 days or more delinquent in this time period. This reflects the fact that not all borrowers and/or properties located in hurricane-affected areas were directly impacted or unable to make payments as a result of the hurricanes. Of this already small cohort, only 4.6 percent (or 2 basis points of overall CAS UPB) remains delinquent today, which means that roughly 95% of such loans that were 60 days or more delinquent have cured or prepaid. We find that the majority of these cures are associated with loans that have been modified. As we discuss in this commentary, most of the modifications on this population are Extend for Disaster Relief and Cap and Extend for Disaster Relief modifications. With a year of performance history on the earliest post-hurricane modifications, we find that performance has been strong with 97 percent of the loans modified in 1Q2018 either current or prepaid in full.
Exhibit A. Loan Performance in Hurricane-Affected Regions (as of June 2019 Activity Period)
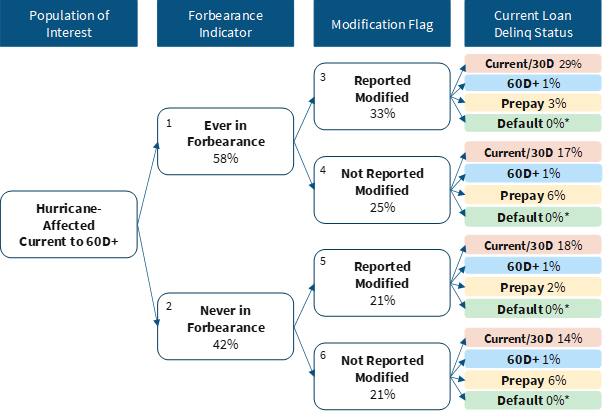
Source: Fannie Mae. Numbers may not sum to 100 percent due to rounding. Values denoted with an asterisk represent non-zero amounts.
Taking Stock of Modifications among Hurricane-Affected Loans
As we discussed in our prior publication, servicers are authorized to grant an initial forbearance plan of up to six months with the possibility of extension to any borrower who they suspect has been impacted by a natural disaster, depending on the borrower's circumstances. During the forbearance period, servicers evaluate the individual situation of each borrower in order to determine the appropriate next steps. In cases where the servicer determines that the borrower will be able to continue to service the debt after resolution of the temporary hardship, a modification to the loan terms may be made. Since our last analysis, the share of modified borrowers has increased to 55 percent of loans that became delinquent (see Boxes 3 and 5 in Exhibit A), as modifications have become permanent following initial trial periods. The population of loans that remain in serious delinquency and have not received a permanent modification declined to 3 percent of hurricane-affected loans that became delinquent (or 1 basis point of overall CAS UPB).
The most common type of modification extended to hurricane-affected borrowers is the Extend Modification for Disaster Relief, which simply extends the term of the mortgage in the amount of payments missed (not to exceed 12 months) without capitalizing arrearages. This type of modification is believed to be most suitable for borrowers that can maintain their current mortgage payments. A similar modification program that is also prevalent in the subject population is the Cap and Extend Modification for Disaster Relief. It entails capitalizing arrearages, reducing the interest rate under certain conditions, extending the loan term in monthly increments up to 480 months from the mortgage loan modification effective date, and re-amortizing the mortgage loan over the term needed to achieve a monthly principal and interest (P&I) payment roughly equal to or, in some instances, lower than the pre-modification payment.3
Another modification program that has been used for some of the hurricane-affected population is the Flex Modification program. In 2017, Fannie Mae replaced legacy modification programs, including the Home Affordable Modification Program (HAMP) and the Fannie Mae Standard and Streamlined Modifications, with the Fannie Mae Flex Modification program. We compared the methodology and costs of these programs in a commentary published in December 2016.
Other loan workout methods that resulted in the borrower returning to performing status include reinstatement, repayment plan, and long-term forbearance.
Identifying Modifications in CAS Remittance Data
Investors can generally identify which type of loan modification has been granted to a borrower by referring to the information provided in the monthly remittance data (see Exhibit B below for reporting fields). As a reminder, the Modification Flag is not populated as "Y" and the terms of the loan are not updated until a trial modification has successfully been converted into a permanent modification. Modified loans in fixed severity CAS deals are identified with the Modification Flag; however, given that modification costs are not passed on to investors in fixed severity deals, the Modification Loss Amount field is not populated for such loans.
As noted in Exhibit A above approximately 55 percent of hurricane-affected loans that became delinquent are now identified as being modified. Exhibit C below illustrates that most of these borrowers – over 40 percent – received Extend for Disaster Relief modifications, resulting in a term extension but not a rate reduction or principal forbearance. Correspondingly, the change in payment, if any, is minimal. Approximately 35 percent of the modified population received a Cap and Extend for Disaster Relief modification. The remaining loans received a Flex Modification.
Exhibit B. Loan Modification Types in CRT Reporting
| Extend Mod for Disaster Relief | Cap and Extend Mod for Disaster Relief | Flex Modification | |
|---|---|---|---|
| Modification Flag | Y | Y | Y |
| Current Interest Rate | Equal to Original Interest Rate | Equal to or lower than Original Interest Rate 3 | Equal to or lower than Original Interest Rate 3 |
| Current Unpaid Principal Balance | Generally remains the same or declines after modification | Generally increases in the month of modification in the amount of capitalized arrearages | Generally increases in the month of modification in the amount of capitalized arrearages |
| Remaining Months to Legal Maturity | Adjusted to reflect term extension no greater than 12 months (in the number of months of payments missed) | Adjusted to reflect term extension (generally less than 480 months); in some cases, term may be shortened | Adjusted to reflect term extension to 480 months at time of modification |
| Non-Interest Bearing UPB (Principal Forbearance) | Generally null | Generally null | If principal has been permanently forborne, non-zero amount |
| Forbearance Indicator (Forbearance Plan) | Generally null | Generally null | Generally null |
| Modification Loss Amount | Generally null | May or may not be non-zero | May or may not be non-zero |
| Principal and Interest Payment (calculated using Current Actual UPB, Current Interest Rate, and Remaining Months to Legal Maturity) | The modified P&I payment is generally the same or very close to the pre-modification P&I payment | The modified P&I payment is generally close to or lower than the pre-modification P&I payment | The modified P&I payment is generally lower than the pre-modification P&I payment |
Like the Cap and Extend modifications, few Flex Modifications resulted in a rate reduction or principal forbearance. However, the amount of term extension was much longer for Flex Modifications, as the modification waterfall automatically extends the term to 480 months from the effective date of the modification (as seen in Exhibit C). As a result, these borrowers experienced a much larger payment reduction than those borrowers receiving a Cap and Extend for Disaster Relief modification. A Modification Event and associated Modification Loss Amount only apply in the case of principal forbearance and certain rate reductions, not as a result of term extension in the absence of either principal forbearance or rate reduction. Despite their similar nomenclature, a forbearance plan is a different concept from principal forbearance; the former does not have a cost impact to CRT investors.
Exhibit C. Classification of Ever Modified Loans in Hurricane-Affected Regions
| Modification Type | Rate Reduction? | Term Extension? | % of Modified UPB | Avg Rate Reduction | Avg Term Extension (Mos) | Avg Payment Change |
|---|---|---|---|---|---|---|
| Extend for Disaster Relief |
No | Yes No |
40% 2% |
N/A N/A |
6 N/A |
0% 0% |
| Cap and Extend for Disaster Relief |
Yes No |
Yes No Yes No |
3% 5% 28% 0% |
-0.27 -0.55 N/A N/A |
10 N/A 19 N/A |
-1% 0%* 0%* 0%* |
| Flex Mod | Yes No |
Yes No Yes |
4% 0% 18% |
-0.42 -0.85 N/A |
140 N/A 150 |
-19% -6% -14% |
*Values denoted with an asterisk represent non-zero amounts
Measuring Modification Success Rates
With a year of performance history on the earliest post-hurricane modifications, we can take stock of modification success rates over time. As seen in Exhibit D, post-modification loan performance has been strong. A year after receiving a permanent modification, roughly 82 percent of the 1Q2018 cohort was current and an additional 15 percent had prepaid in full, leaving just 3 percent in serious delinquency. Early performance for loans modified in later quarters has been in line.
Exhibit D. Performance of 2018 Modifications by Modification Type
| Mod Quarter | Current Status | 3M Post-Mod | 6M Post-Mod | 9M Post-Mod | 12M Post-Mod |
|---|---|---|---|---|---|
| 1Q2018 | Current Prepaid Delinquent |
95% 3% 2% |
90% 8% 3% |
86% 10% 4% |
82% 15% 3% |
| 2Q2018 | Current Prepaid Delinquent |
96% 3% 1% |
93% 5% 2% |
91% 7% 2% |
N/A N/A N/A |
| 3Q2018 | Current Prepaid Delinquent |
95% 2% 3% |
94% 4% 2% |
N/A N/A N/A |
N/A N/A N/A |
| 4Q2018 | Current Prepaid Delinquent |
95% 2% 3% |
N/A N/A N/A |
N/A N/A N/A |
N/A N/A N/A |
Implications for CRT Investors
Since moving to an actual loss regime beginning with CAS 2015-C04, the CAS program has passed modification loss amounts through to investors through the transaction waterfall. In actual loss CAS deals, a modification event occurs when a loan experiences permanent principal forbearance and/or interest rate reduction. In such circumstances, the modification loss amount is generally comprised of forgone interest due to interest rate reduction and/or principal forbearance.4 Capitalization of arrearages, term extension, and principal forgiveness do not explicitly generate a modification loss amount. Because Extend for Disaster Relief and most Cap and Extend for Disaster Relief modifications do not entail principal forbearance or interest rate reductions, they generally do not result in modification losses for CAS investors.
Consequently, the share of loans in CAS deals with disaster-related modification losses has been small and has largely plateaued (as seen in Exhibit E). As a percentage of the of CAS reference pool UPB, only 8-10 basis points of hurricane-affected loans have modification losses in 2015-17 Group 2 deals. Modification losses are significantly rarer among Group 1 loans because only loans with a mark-to-market LTV greater than or equal to 80 percent are eligible for an interest rate reduction in the modification waterfall. Correspondingly, modification losses associated with disaster relief have been minimal (as seen in Exhibit F). Modification losses are first applied to the accrued interest due to the junior-most tranche, typically retained by Fannie Mae for the CAS deals issued thus far and bearing a reference coupon of 10 percent or more. At less than 0.01 basis points per month across 2015-2017 Group 2 deals (as seen in Exhibit F), modification losses among hurricane-affected loans have been significantly lower than the interest due on this tranche.
Exhibit E. Modification Activity in Actual Severity CAS Deals
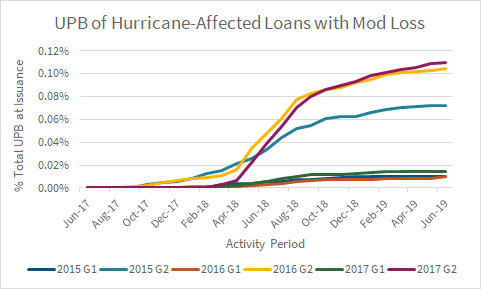
Exhibit F. Modification Losses in Actual Severity CAS Deals
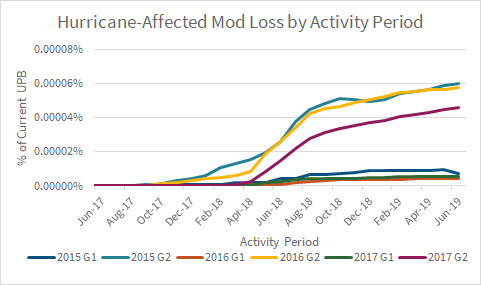
Note: Hurricane-affected loans refers to loans impacted by Hurricanes Harvey, Irma, and Maria. Actual loss deals only. Shows performance for hurricane-affected loans with modifications that occurred after Aug 2017.
Wrapping Up
Fannie Mae offers a range of flexible options to borrowers affected by hurricanes, wildfires, and other natural disasters as they work to recover and rebuild their communities. Our standing disaster relief policies allow servicers to provide immediate relief through temporary forbearance to borrowers in hurricane- and other disaster-affected areas and determine the most appropriate long-term resolution. For most borrowers that became delinquent in the aftermath of the 2017 hurricane season, this resulted in loan modification, primarily the Extend for Disaster Relief and Cap and Extend for Disaster Relief programs. The terms of these modification programs have allowed borrowers to cure and resulted in de minimis losses passed on to CAS investors . Post-modification performance has been strong with nearly all loans from the 1Q2018 cohort either current or prepaid in full one year after modification.
Additional Resources
- Learn more about our standard guidance and information for disaster assistance on Fannie Mae's Disaster Relief webpage
- Explore our suite of credit risk transfer vehicles via Fannie Mae Credit Risk Transfer Programs page
- Download our Single-Family Loan Performance Dataset
- Take a deep-dive into our Single-Family's Credit Risk Management Deck
- Sign up for News and Commentary or our free data analytics platform Data Dynamics
1 For the purpose of this analysis, we define hurricane-affected loans as those located in counties designated by FEMA for Individual Assistance. We refer to loans impacted by Hurricanes Harvey, Irma, and Maria.
2 We isolate loans referenced in CAS transactions for the purpose of this commentary as only CAS transactions contemplated modification costs at the time of the 2017 hurricanes.
3 For fixed-rate mortgages with a mark-to-market loan-to-value (MTMLTV) ratio less than or equal to 80 percent, the mortgage rate does not change. For fixed-rate mortgages with an MTMLTV ratio greater than 80 percent, the modified mortgage rate is the lesser of the current note rate or the Standard Modification Rate.
4 For any Reference Obligation that has experienced a Modification Event, the Modification Loss Amount is defined as the excess, if any, of (a) one-twelfth of the Original Accrual Rate multiplied by the UPB of such Reference Obligations over (b) one-twelfth of the Current Accrual Rate multiplied by the interest bearing UPB of such Reference Obligation.
This commentary is provided by Fannie Mae solely for informational purposes based on information available at the time it is published. This document is based upon information and assumptions (including financial, statistical or historical data and computations based upon such data) that we consider reliable and reasonable, but we do not represent that such information, assumptions, data, or computations are accurate or complete, or appropriate or useful in any particular context, including the context of any investment decision, and it should not be relied upon as such. It is subject to change without notice. Fannie Mae disclaims any responsibility for updating the commentary or the opinions or information discussed herein. The opinions presented in the commentary represent the views of professionals employed by Fannie Mae of certain factors that may impact the performance of certain loans in Connecticut Avenue Securities reference pools. The effect of factors other than those assumed, including factors not mentioned, considered or foreseen, by themselves or in conjunction with other factors, could produce dramatically different performance or results. Statements in this commentary regarding the future impact of data quality improvements are forward-looking, and actual results may be materially different due to, among other reasons, those described in "risk factors" in our most recent Form 10-K and Form 10-Q. Fannie Mae does not represent that such views are the sole or most accurate explanations for loan performance or that there are not credible alternative views or opinions. Fannie Mae publishes this commentary as a service to interested parties and disclaims any liability for any errors contained herein. Fannie Mae securities are more fully described in applicable offering circulars, prospectuses, or supplements thereto (such applicable offering circulars, prospectuses and supplements, the "Offering Documentation"), which discuss certain investment risks and contain a more complete description of such securities. All statements made herein are qualified in their entirety by reference to the Offering Documentation. An offering only may be made through delivery of the Offering Documentation. Investors considering purchasing a Fannie Mae security should consult their own financial and legal advisors for information about such security, the risks and investment considerations arising from an investment in such security, the appropriate tools to analyze such investment, and the suitability of such investment in each investor's particular circumstances.